

It is highly important that we regularly assess our day-to-day marketing activities. This is due to there being so many marketing activities at our disposal. As well as there being an infinite approaches to take.
Key performance indicators is the process of evaluating the effectiveness of your marketing activities. Furthermore, it is adding a measure to each activity, so that we can assess the amount of value each activity brings to us and our customers.
In this article, I will discuss more about key performance indicators (KPI). By which you will learn how you should be measuring your marketing activities.
1. What Are Key Performance Indicators (KPI)?
Key performance indicators measure the success of your business, and can determine whether or not you are able to meet your short term and long terms goals.
The main objective is to know exactly how viable you are in the market. To get a clear idea of this we must first understand many people are interested in your products.
If your product is not meeting its potential then by applying key performance indicators you can evaluate why it is not meeting its potential.
We do this by setting benchmarks of the expected, or required target to remain sustainable and reach ROI targets.
Overall, by assessing the marketing we can eliminate those activities that are least important for us. As well as, setting baselines to improve the quality of service and customer experience on the activities that work best.
2. Why Are Key Performance Indicators Important?
One of the biggest challenges people have is managing and understanding why customers churn.
When you take a look at the data we can see that customers experience has to be nurtured and maintained to ensure competitive advantage.
If you are not providing the right service for your customers they WILL NOT not return.
The data CallMiner shows is that companies lose $136.8 billion per year in the US because customer switching to the competitors. The American Express report that 3% of Americans say they will switch after experiencing just a single instance or poor service. In addition, a PWC reports shows that 54% of people say that businesses need to see better service. Whilst only 45% of firms actually focus on customer experience as their first priority.
Customer experience effects every interaction between business and customers. These interactions have to be right, by which we need to monitor our interactions by setting key performance indicators and meeting baselines for quality.
3. Measuring The Quality Of Your Website
3.1 User Experience
The main measure you can use to assess the quality of your user experience for your website is by tracking the bounce rate and exit rate.
3.2 Bounce Rate
Bounce rate is a measure provided free by Google Analytics, and it is the percentage of visitors that enter your website and then leave without viewing other pages.
The idea is to get a bounce rate as low as possible. So you have to provide information and meet the visitors needs as best you can. General factors for high bounce rate include:
- Loading times – the website take to long to load
- Broken links – your visitors get an error when they click links
- Text size and display – the text might be to small
- Unclear menu items – if your website has a poor structure or unclear
- Responsiveness – not having a mobile friendly site
3.3 User Intent
Another element of providing a good customer experience is knowing the visitors intention. This is known more so online as user intent. This is usually referred to how well a website meets a person’s wants. You can provide a better user experience if you know exactly what the visitor intends to do once they reach your website.
3.4 Linking Path
I.e. a search engine search term or a link. This is measured by the click through rate (CTR) of the meta titles and meta descriptions of your search engine results page (SERP). Or other media path such as social media or email.
3.5 Landing Page
The quality of the content copy. Basically, content meet the needs of the visitors. If a visitor has come through google search keyword; the content must deliver the answer to the google query. Otherwise, this is a factor why bounce rate is high. If you have a high click through and a high bounce rate then the landing page content is a consideration for improvement. However, this high bounce rate is an indicator more detailed analysis will need to be conducted for the User experience factor.
3.6 Call To Action
What action do the users want to take after visiting the landing page. Do you provide that action?
If you have provided a good user experience there is always a action someone will want to take. You can measure this by conversions rate.
4. Measuring The Quality For SEO
Over the past 20 years, Google has built a sophisticated piece of software that scans the internet and verifies which websites should appear in their search engine.
Moreover, we call this software rank Brain Rank and it uses measures to determine the best way to prioritise this information.
This software first send outs bots and then collects all information online. It then uses an advanced algorithm to both check and assess the quality of this information.
In this section, I will go over all the measures Google uses to determine how they position your website. If we start to increase these measures, you then will naturally see an increase in the search engine results page.
4.1 Single Word Click-Through-Rate
In Google’s guidelines, they say single word click through rate is a measure they use to see how relevant your website is to each search query. Google assesses this by comparing the amount of clicks a web page gets against other websites of a similar topic.
For example, when I type classical guitar into Google, it then presents me with a list of options I can click.
Single Word Click-Through-Rate Example
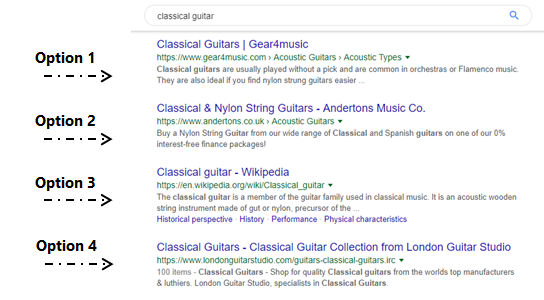
Google will then assess which option will get the most clicks. If option 2 gets more clicks that option 1, it will then appear higher in the results for that same search query in the future.
4.2 Impressions
These first determine how much demand is within your search term your trying to rank for. As a digital marketer you will face search terms that have high demand, which could result in hundreds of thousands of searches each month. However, usually the higher the demand the higher the competition to fight over those words.
4.3 The Average Click-Through-Rate
Google also measures the average click-through-rate for all the keywords that you appear for in the search engine results page.
We understand by measuring the average click through rate is a sign of the sites overall quality.
Average Click-Through-Rate
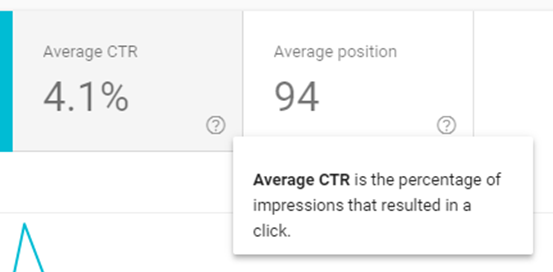
This average click through rate is the total number of impressions, divided by the total amount of times people click each page in the search engine results page.
The good news is that you can find the average click through rate in Google’s search console.
4.4 Average Position
Google also uses the average position of all the keywords to assess level of quality.
If the average position is higher is a measure that tells Google of your sites quality.
4.5 Bounce Rate
Bounce rate and click through rate is a top-level measure that evaluates the user friendliness of your site.
Here is a SEMRush study that shows the correlation between bounce rate and the position in the search engine results page.
4.6 Direct Traffic
It’s confirmed that Google uses data from Google Chrome to determine how many people visit site (and how often). Sites with lots of direct traffic are likely higher quality sites vs. sites that get very little direct traffic. In fact, the SEMRush study I just cited found a significant correlation between direct traffic and Google rankings.
4.7 Repeat Traffic
Sites with repeat visitors may get a Google ranking boost.
4.8 Referral Traffic
Referral traffic is the amount of traffic that links to your website. This traffic is usually considered extremely relevant as well as showing you are a credible source of information as being recommended by the referral websites.
4.9 Pogosticking
“Pogosticking” is a special type of bounce. In this case, the user clicks on other search results in an attempt to find the answer to their query.
Results that people Pogostick from may get a significantly rankings drop.
4.10 Blocked Sites
Google has discontinued this feature in Chrome. However, Panda used this feature as a quality signal. So Google may still use a variation of it.
4.11 Chrome Bookmarks
We know that Google collects Chrome browser usage data. Pages that get bookmarked in Chrome might get a boost.
4.12 Number of Comments
Pages with lots of comments may be a signal of user-interaction and quality. In fact, one Googler saidcomments can help “a lot” with rankings.
4.13 Dwell Time
Google pays very close attention to “dwell time”: how long people spend on your page when coming from a Google search. This is also sometimes referred to as “long clicks vs short clicks”. In short: Google measures how long Google searchers spend on your page. The longer time spent, the better.
4.14 Exit Rate
If a web page has an extremely high exit rate may suggest there is something wrong or is not relevant and so it may not get indexed.
For example, a purchase confirmation page may have a high exit rate because there is no other action that is required.
4.15 Loading Speed
Google has come out a said specifically that page loading speed is a ranking factor.
5. Assessing Leads
In our KPI reports we want to know FOUR things;
- The total amount of traffic on our website, we use sessions
- The total amount of people visit, we use users
- What is the total amount of new visitors, we use new visitors
- What is the total amount of people that return, we subtract the users from sessions
5.1 What Are Sessions?
Sessions are the total amount of times a website is visited. If a new person visiting your webpage counts as 1 session, and if this new person returns to your website it counts as 2 sessions.
5.2 What Are Users?
Users are the total amount of people that visit your website. If a new person visits your webpage it counts as 1 session, and if this new person returns to your website it counts as 2 sessions. However, this is the same person, so it counts as 1 user, as it is the same person that visited two times.
5.3 What Are New Users?
New users are the amount of first time visits to a website. Someone goes to your webpage for the first time and they later return. The new user count will be at 1.
5.4 What Are Returning Visitors?
Returning visitors are the amount of times a user returned to your website. This is calculated by subtracting the number of users from the number of sessions. A person visits the website for the first time, and they later return. This will be counted as 1 new user and 1 returning user. However, they later return 1 more time. This will now be 1 new user 1 returning users.
Also, if a returning user clear their browser cache the cookie that holds the information google uses to calculate will also be gone. That means if a returning user visit your website google will count them as a new user, and if they return to the website after this an they will also count this person as an additional returning user.
Conclusion
In this article i discussed the most common factors for assessing the performance of your website.
we discussed that the aim for a website is to provide the best experience to the user as possible and then which measures we should use to evaluate how well we are achieving them.


