

Knowing how the competition is operating in the market can give you great insight for the long-term success for your business. Moreover, looking at your competition is like looking at the guys answers next to you in an exam. They might not always be right… But, it can guide you to get a better mark.
In marketing and any form of business development there are standardised models that we can use to assess how we stack up against the competition. Competitor analysis models are used to assess how businesses compare in the market. They guide us to research the industry, trying to understand the long and short term direction of competing businesses. This is so we can position ourselves slightly differently in the market to avoid direction competition if possible.
In this post, I will show you competitor analysis models and take you through how to use them.
1. What Is Competitor Analysis?
Competitive analysis is assessing how businesses compare in the market.
It is a strategic management task to outline how surrounding businesses position themselves, and what customer they aim to please.
This analysis provides both an offensive and defensive context of the competitive eco-system.
We do a competitive analysis to identify opportunities and threats in the market.
Competitive analysis is compiling all the research data we collected from our market research and industrial analysis.
When conducting market research, by evaluating how customers perceive the surrounding businesses, we generate a very strong and effective position strategy.
2. Why Is Competitive Analysis Important?
We can see how competitive the surrounding environment is.
This leads us to examining which markets we could enter and be successful; opposed to those markets we will enter and fail.
Overall, the idea is placing our business in a position which we can beat competitors and win customers.
3. Perceptual Map
Perceptual mapping is a model used by marketers that attempts to visually display the perceptions of people in your market.
Typically, the position of a company’s product, product line, or brand is displayed relative to their competition.
3.1 Perceptual Map Example
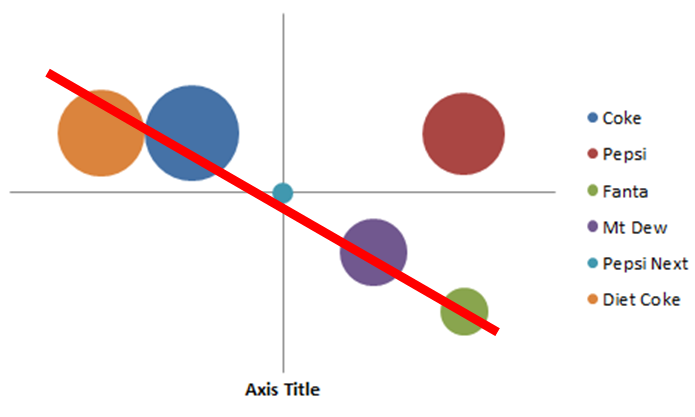
Once we have built the graph and we have plotted the information, we need to draw a line as this makes it easier to see any trends and outliers.
This is because as jobber (2016, p 228) states: any gap is potential to penetrate.
Overall, the information we see in this perceptual map is from conducting market research and the industrial analysis.
4. Blue Ocean Canvas
The blue ocean canvas is a framework to reconstruct the value customers have against the competition.
4.1 Blue Ocean Canvas Example
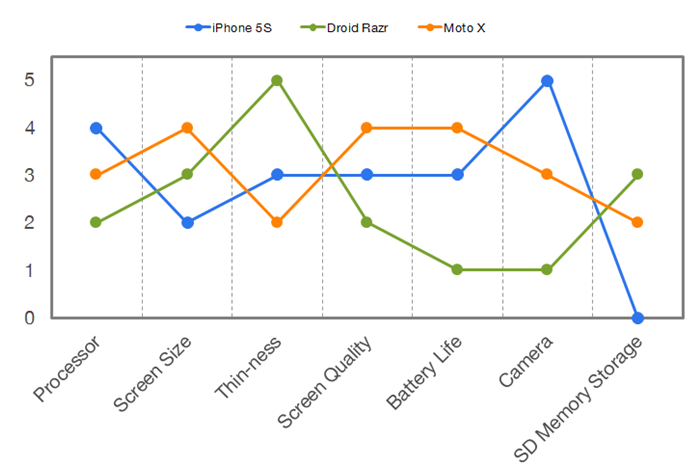
The blue ocean canvas provides a visually pleasing way to demonstrate features across brands and provides a rating.
The information we see in this Blue ocean canvas is from conducting market research and the industrial analysis.
Conclusion
In this post, we learned how to analyse the competition and use them as base lines for our strategies.
References:
Kotler, P., & Armstrong, G. (2013). Principles of Marketing (16th Global Edition).
Porter, M. E., & Millar, V. E. (1985). How information gives you competitive advantage.
Kotler, P. and Armstrong, G. (2012). Principes of marketing. 14th ed. Amsterdam: Pearson Education, p.439.


